A data collector set is a collection of saved perfmon counters. Once a data collector set is created it can be reused and it’s not necessary to select the counters again. Also, the data collected can be saved to a binary file, SQL Server, or CSV for analysis.
I create three data collection sets with the following themes:
- OS
- Processing
- Querying
For a full list of counters included in these themes see Perfmon Counters I Collect For SSAS Monitoring.
Creating a data collector set is easy. To create one manually (not from a template) perform the following steps:
-
- Open Perfmon from the start menu. From Start type Perfmon and select Performance Monitor
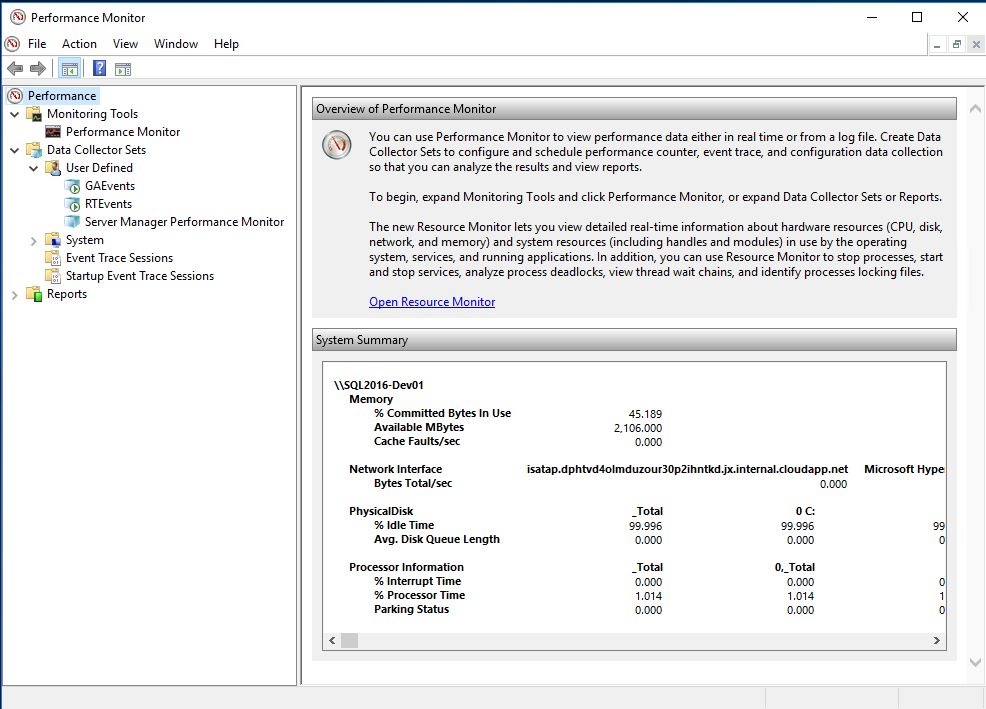
- Expand Data Collector Sets
- Expand User defined. (System does not include SQL Counters)
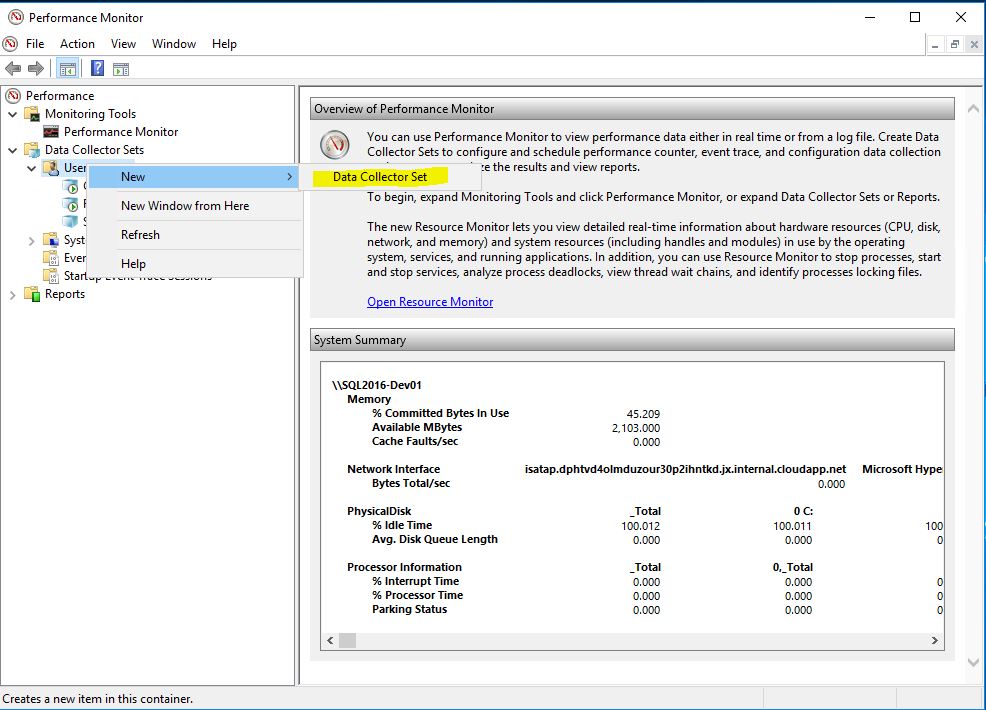
- Right Click User Defined and select New > Data Collector Set
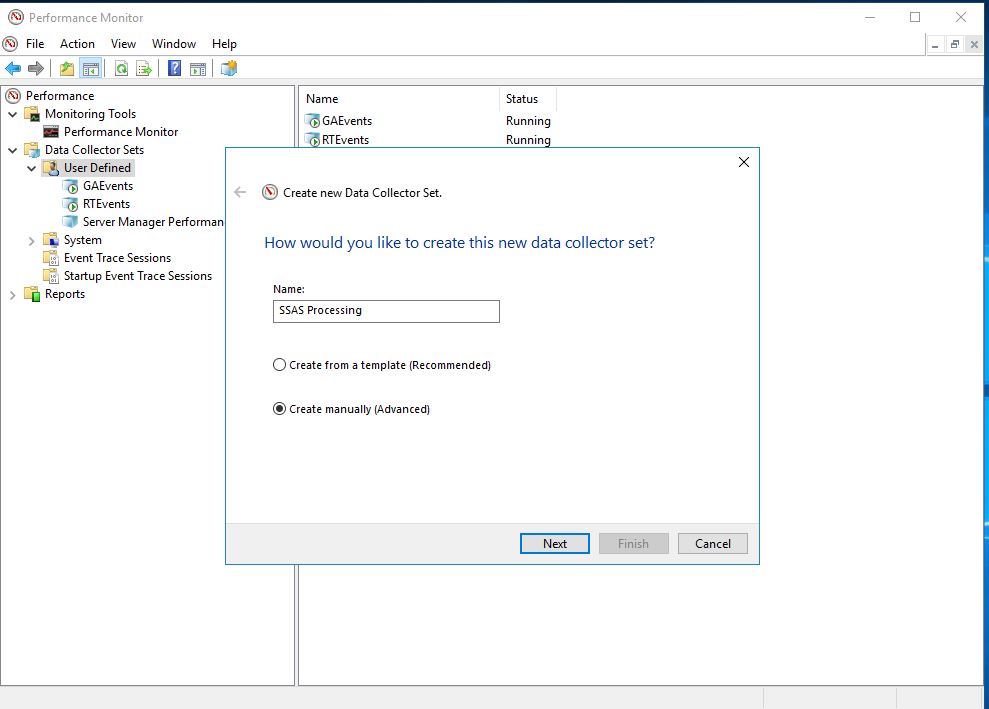
- Rename the collector set. In this case, I’m creating a data collector set named SSAS Processing
- Select the Create Manually (Advanced) radio button and click Next
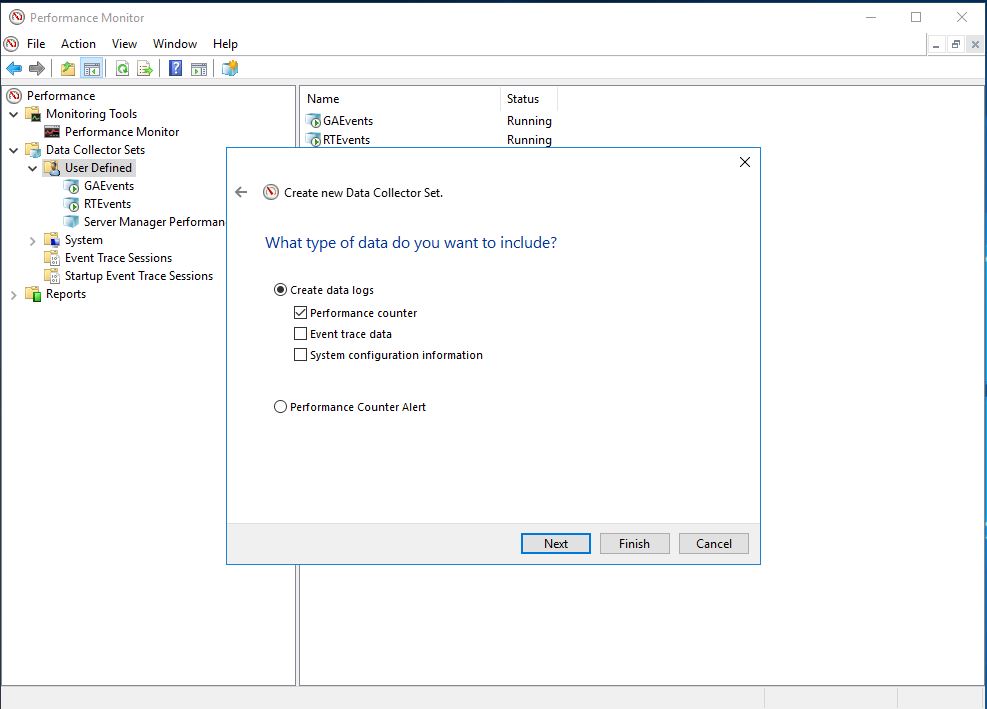
- Select create data logs radio button and check Performance counter check box and click Next
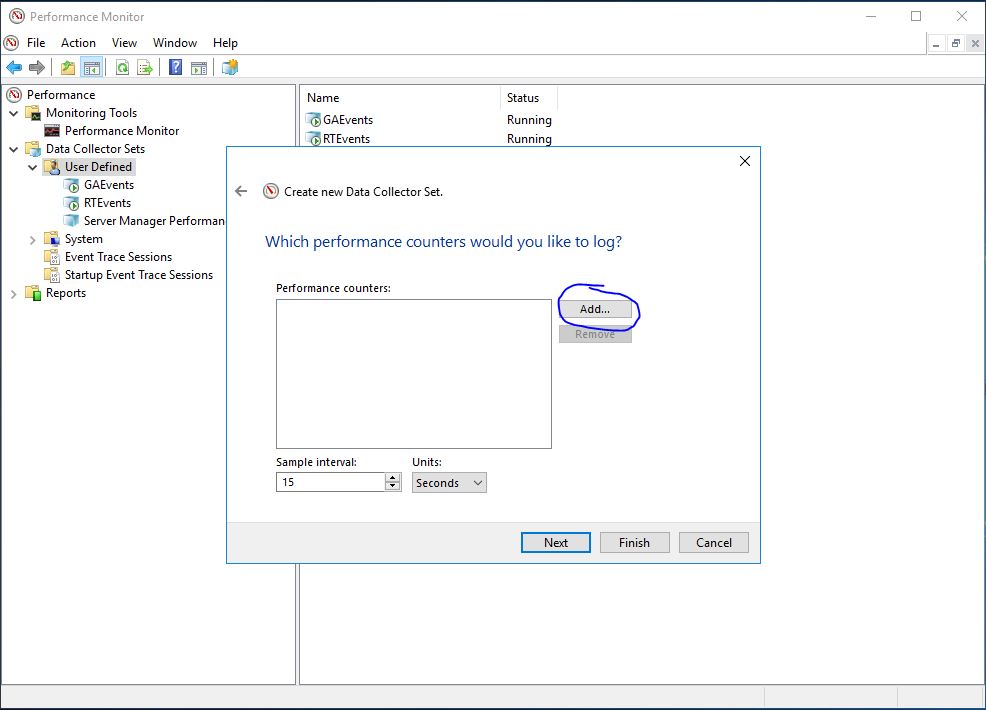
- I keep 15 seconds as the interval. Click the Add button.
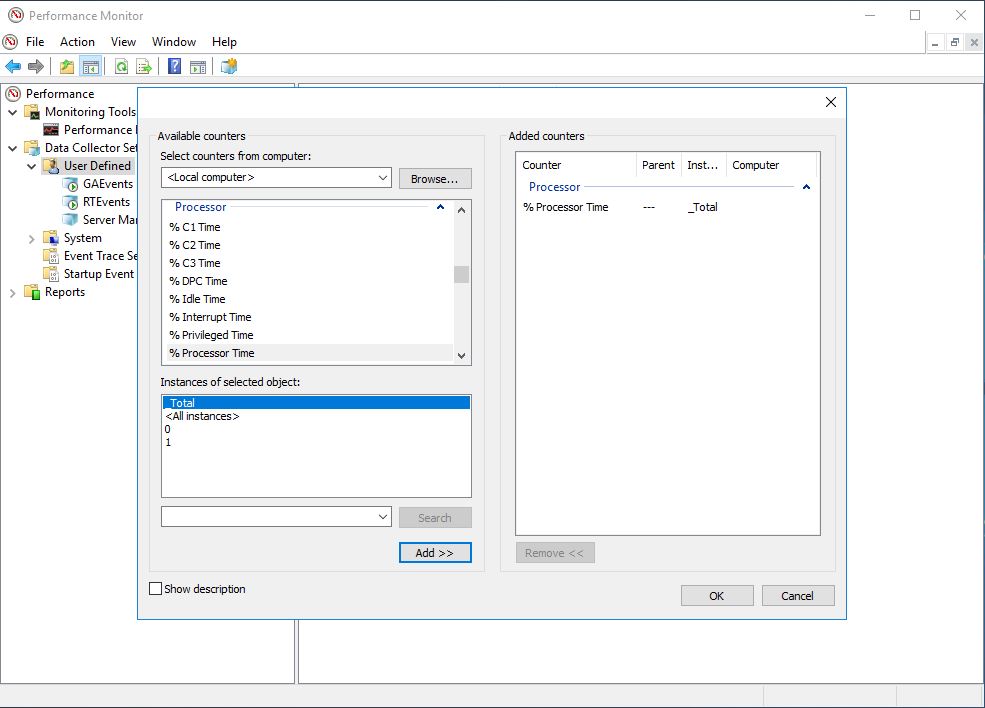
- Select the necessary counters and click OK. In this case, I’m select percent processor time for demonstration. Again, the full list of counter I collect can be found at Perfmon Counters I Collect For SSAS Monitoring. This is the most time consuming part, but it only has to be done once.
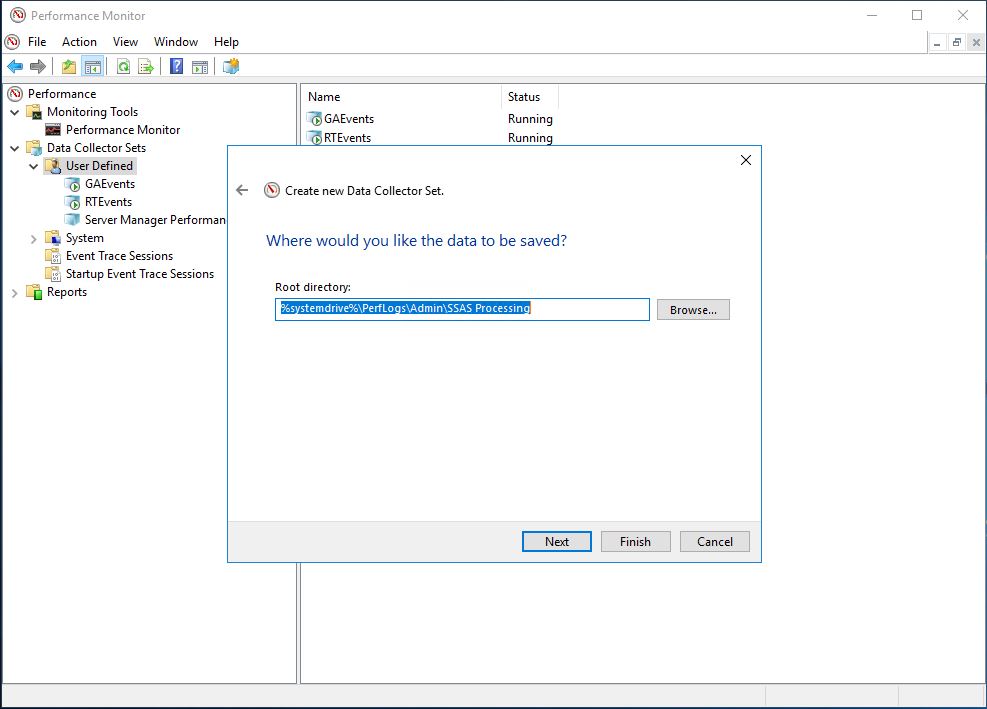
- specify the location to save the data and click Next
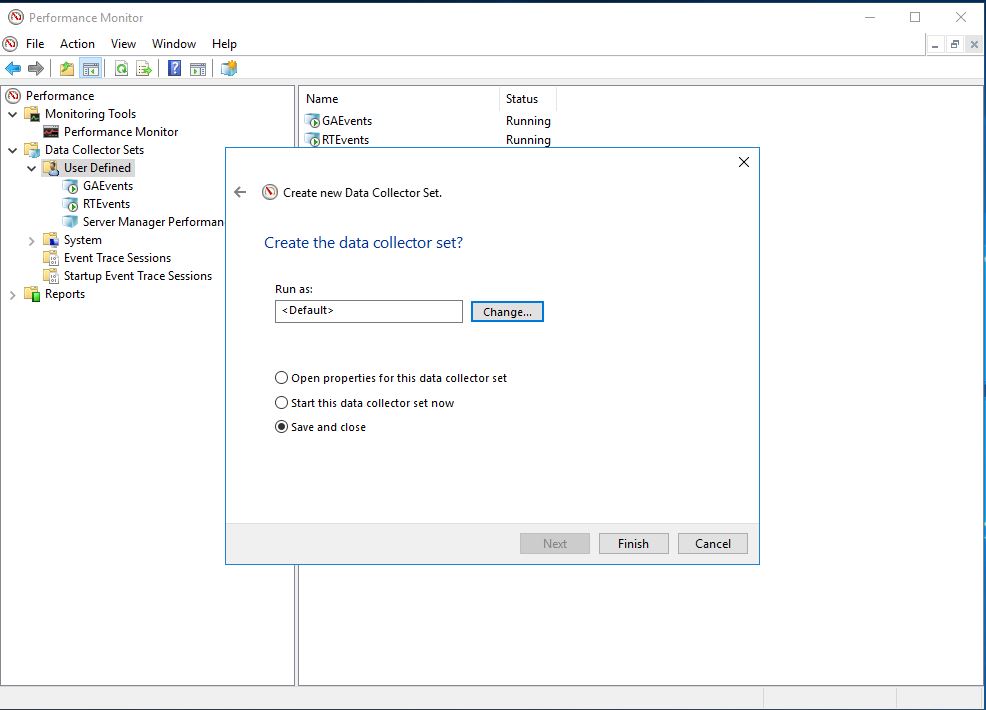
- Keep the <default> user in the run as text box.
- Select the Save and close radio button and click Finish
- Open Perfmon from the start menu. From Start type Perfmon and select Performance Monitor
- Now, the data collector set is created. There’s one property I tweak. I want the output file name to inlclude the name of the data collector set, the date, and the computer name. To accomplish this, perform the following steps:
-
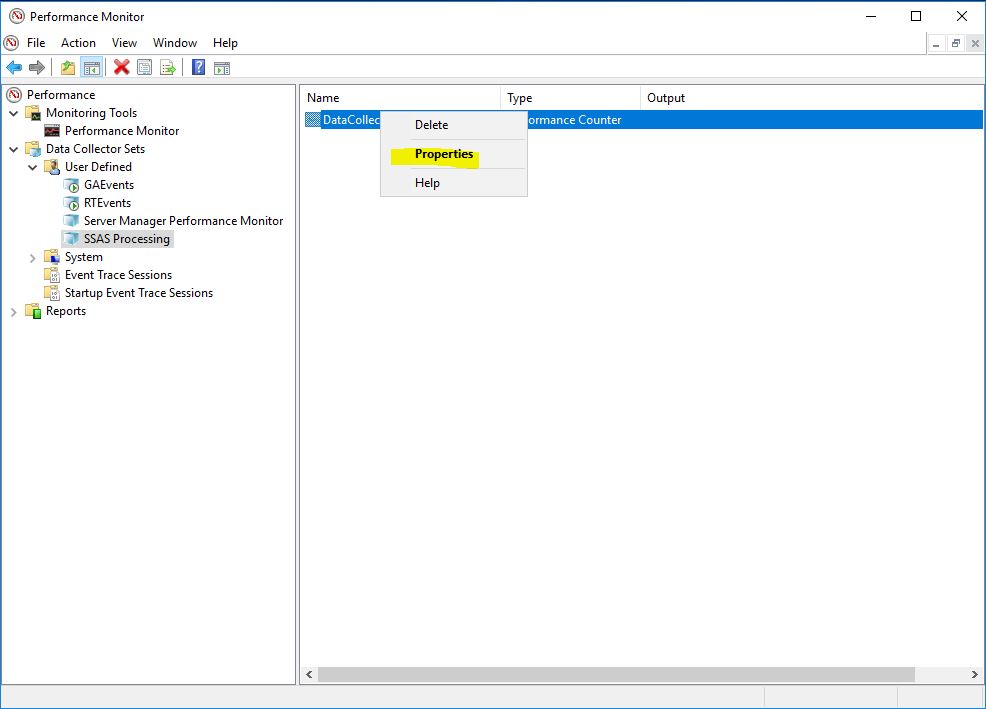
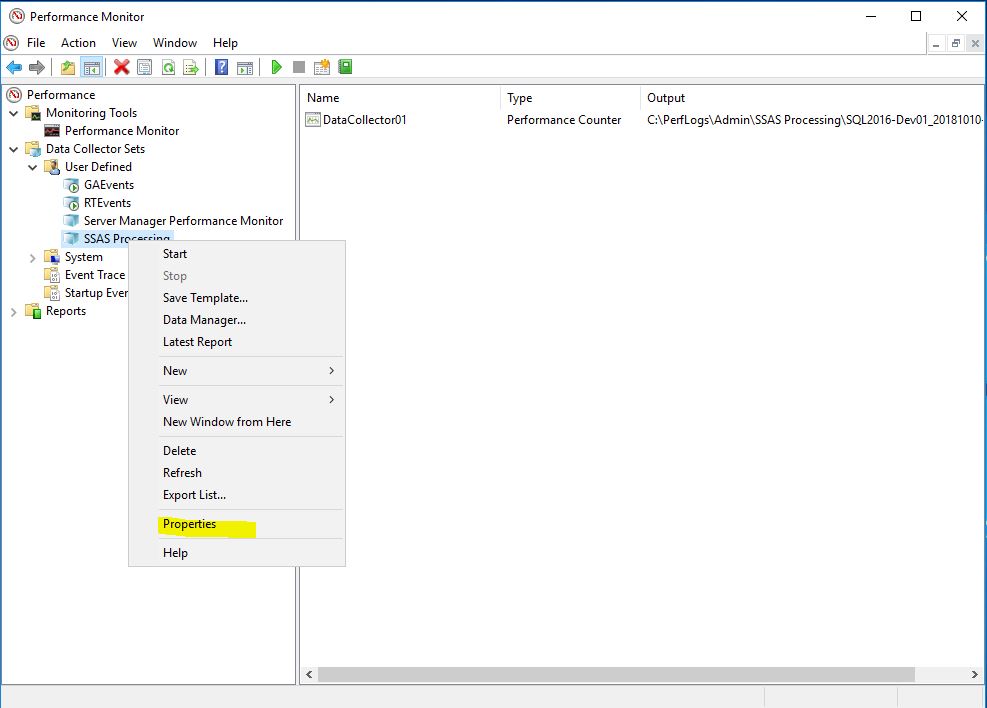
- Select the name of the data collector set in the left pane and then right click the DataCollectorSet in the right pane. Select Properties from the menu.
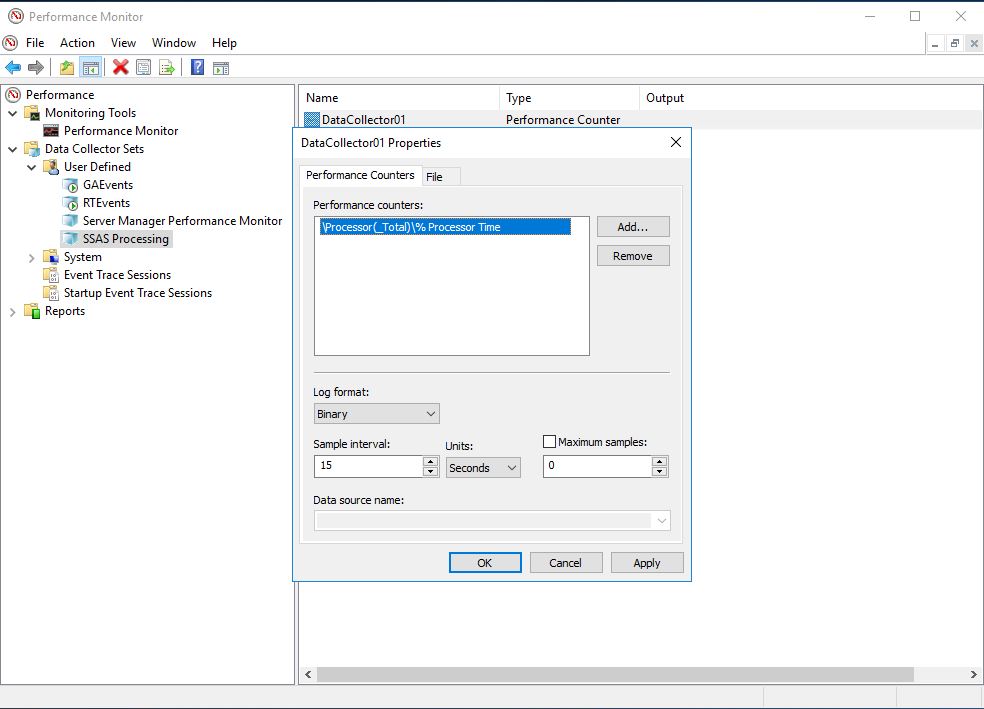
- Notice Log format drop down on the Performance Counters tab. This is where the output format can be changed to SQL or CSV. I leave it as Binary because it performs the best. A tool called relog is available for parsing the binary file. Select the File tab.
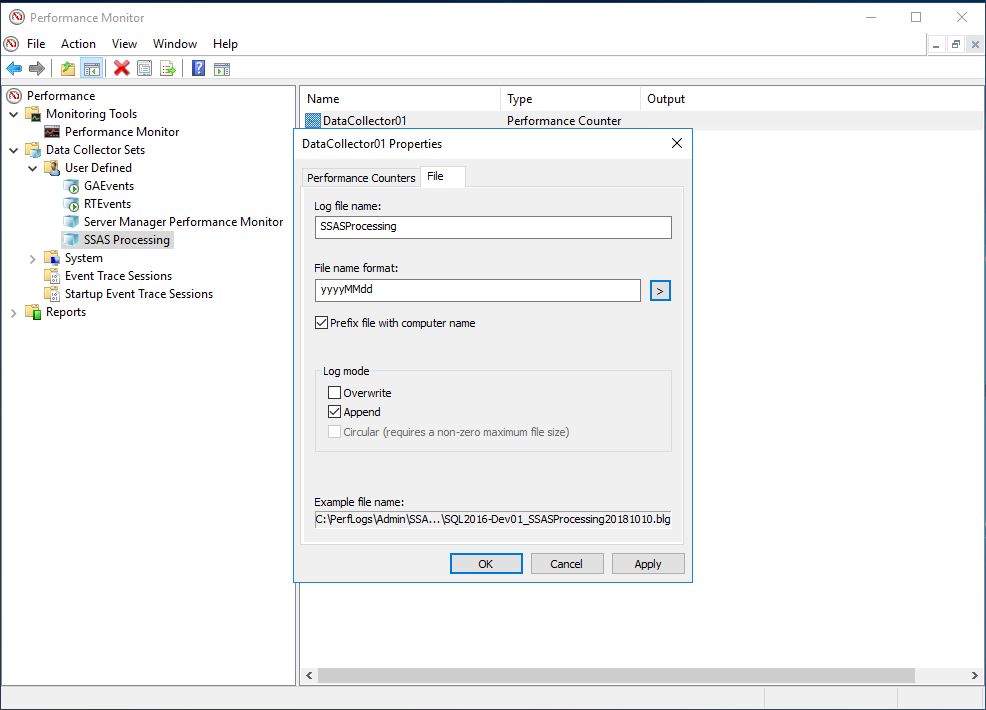
- I change the Log file name to be the same as the data collector set name. Also, check the Prefix file with computer name check box. Finally, enter yyyyMMdd in the File name format text box. Click Ok.
- Select the name of the data collector set in the left pane and then right click the DataCollectorSet in the right pane. Select Properties from the menu.
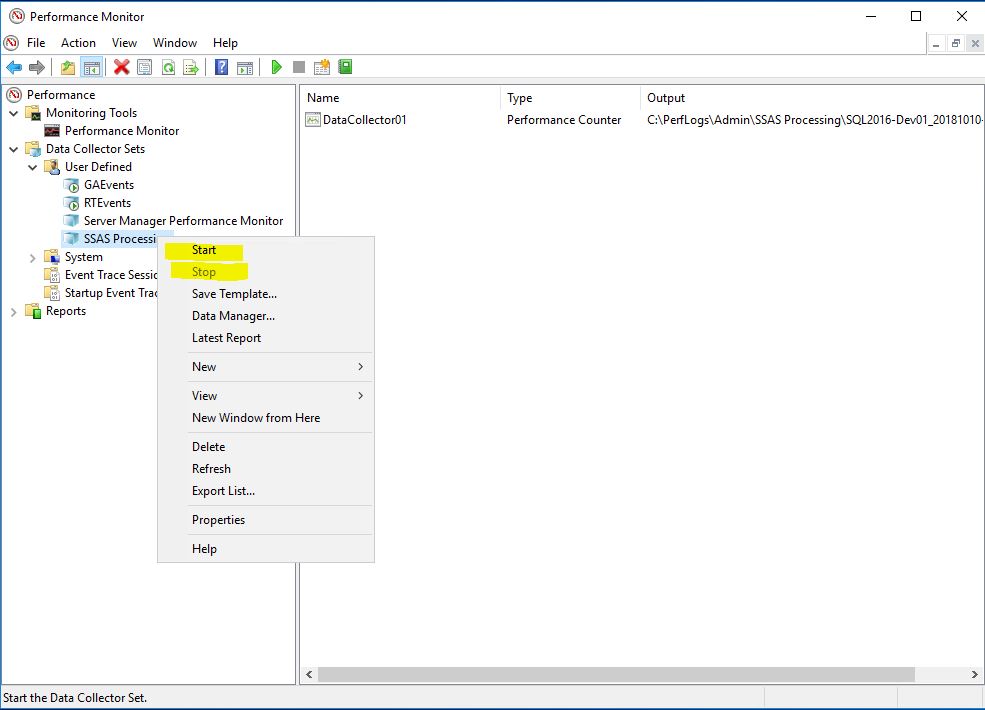
The data collector set has been created and the file format is the way I want it. There’s a few way to start the data collection. One way is to right click the name of the data collector set and select Start or Stop respectively.
Another way to start a data collector set is to schedule it. A schedule can be created in the data collector set properties. To create a schedule right click the name of the data collector set and select Properties.
Next, select the Schedule tab and click the Add button.
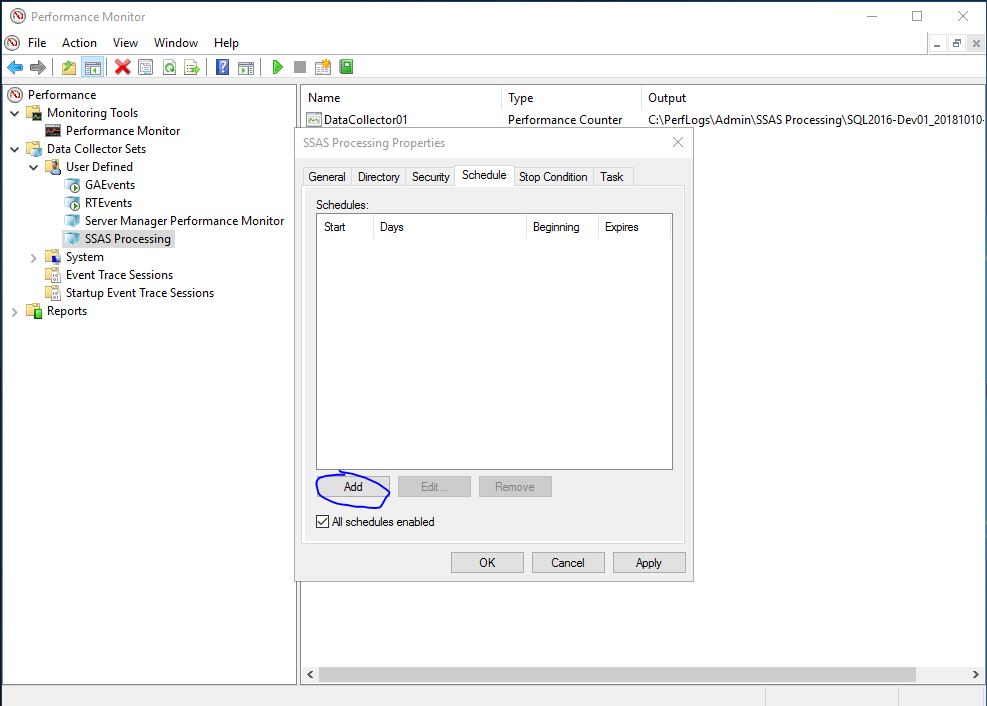
It’s possible to create multiple start schedules based on your needs. However, it’s not possible to create a stop schedule. If you look at the Stop Condition tab you will see it’s only possible to stop data collection based on duration.
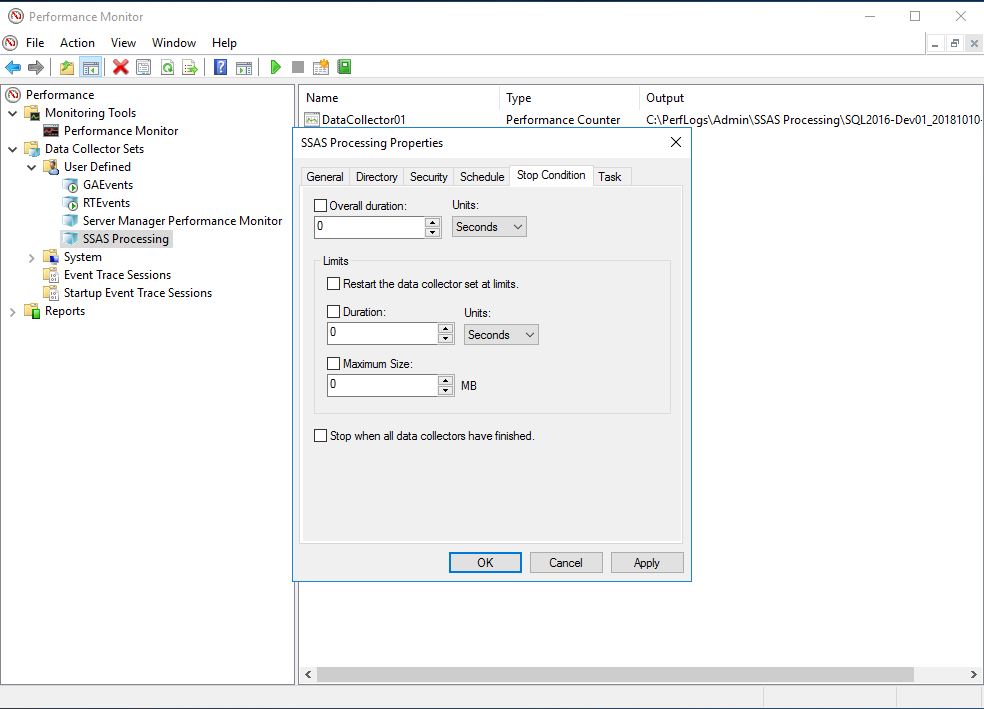
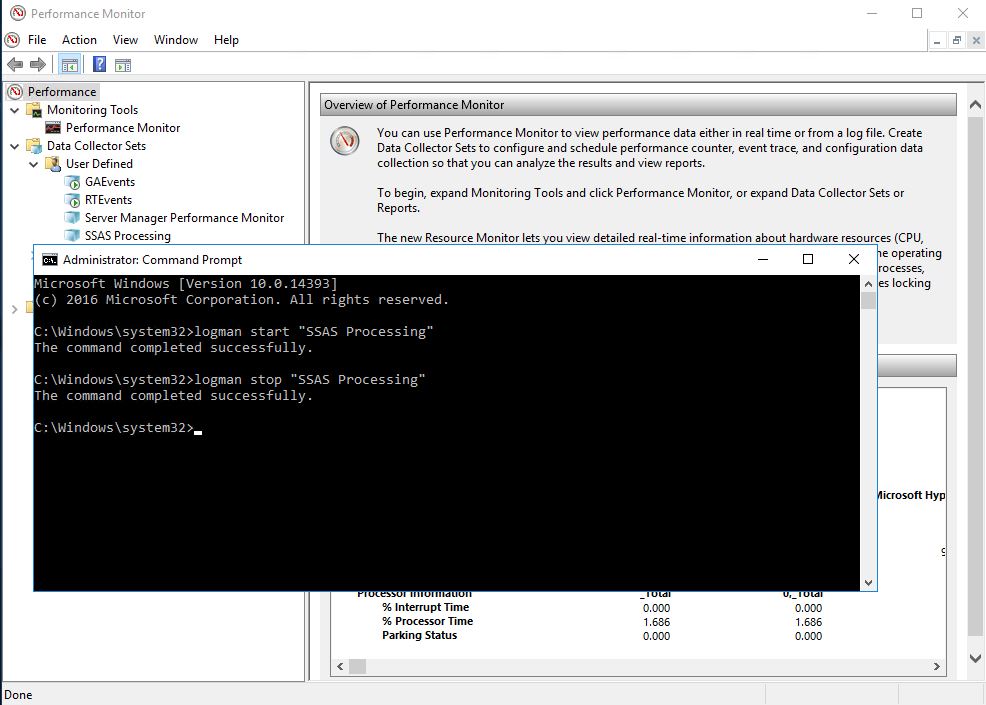
For this reason, I don’t use the built in scheduling. Instead, I use a command line tool called logman. To start a data collection set use the start command followed by the name of the data collector set.
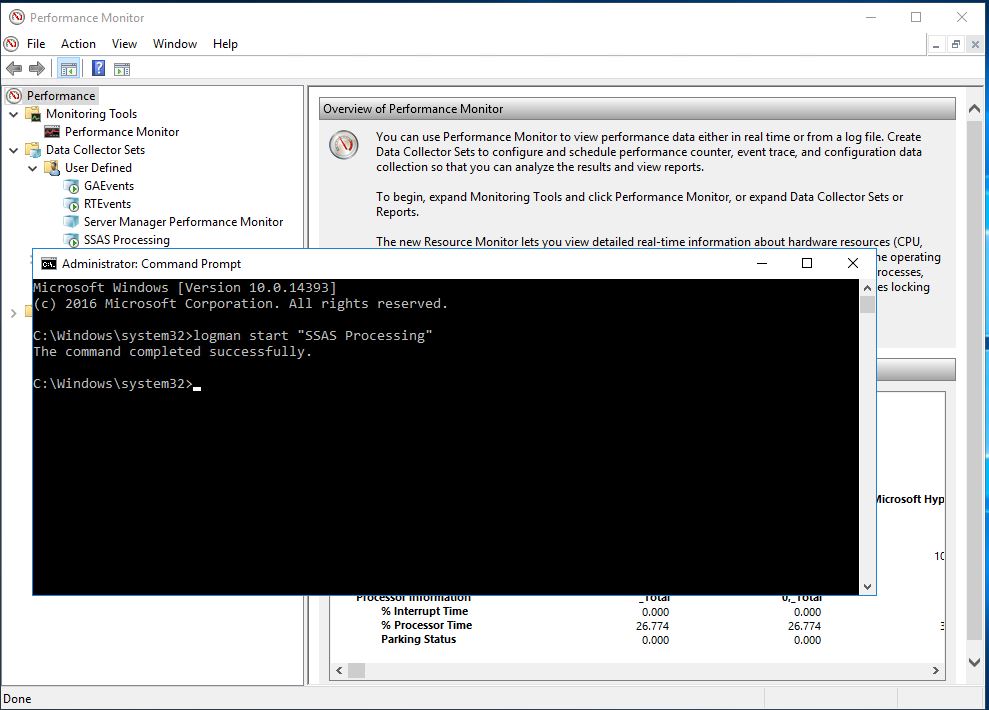
To stop a data collector set use the stop command followed by the name of the data collector set.
I find the Logman method to be easy and flexible. It’s easy to execute a command line from almost anywhere in a windows environment. Therefore, I can start and stop the data collection set from ETL processes, SQL Agent, Cube Processing jobs, etc…